
Last Updated on August 13, 2021 by Bo Jacober
Marc Andreessen famously made the case that “software is eating the world,” stating that “we are in the middle of a dramatic and broad technological and economic shift in which software companies are poised to take over large swathes of the economy.”
We can take that a step further. Programming, at its core, is about understanding and manipulating data. Software exists to receive input and create output. Data in, data out. We feed data into spreadsheets, scripts, programs, social networks, and machine learning algorithms, and our trusty software processes it, manipulates it, and uses it to help us achieve goals.
Contents
Data is Eating the World
I am not a data scientist. I am a developer. A teacher. A manager, dad, coach, and more. Collecting, processing, and interpreting data is important in all of these roles. In this way, we are all data analysts. We all have tools and tricks for analyzing data. For sports or games, we interpret and predict from simple data like scores to complex data, like PITCHf/x data from baseball. For relationships, we process verbal and visual information to converse, build trust, live together. And when we make mistakes, we adjust our approach.
At work, the ability to analyze data is needed in more ways than ever before. I’ve worked in IT and software development for 15 years now, and everyone I’ve ever worked with has needed to put on a Data Analyst hat from time to time. There is so much need for these skills, and there are so many opportunities today.

Different jobs need Data Analysts at all sorts of levels. For a research assistant working in a lab, maybe you just need to know how to process data in a spreadsheet and create some charts and graphs. As a financial analyst working with a team in a larger company, you need to know how to model and forecast data over time. On some of the software development teams I’ve worked on, analysts would compile and study user data, and developers would write complex reports with SQL.
Our goal at Treehouse is to help people learn skills needed for data analysis and programming. We provide a lot of learning material on databases and data analysis, and are continuing to add more each month. If you’d like to learn more about building these skills, I recommend starting with our Beginner SQL track, and then exploring the Data Analysis material from there.
Data Analysis Provides Answers
We analyze data so that we may answers to questions like:
- How many units did we sell last month?
- How many units do we think we can sell next month?
- How are users discovering our site or service?
At Treehouse, we have more questions than we can answer about our students:
- How many students are active in our courses each week?
- What material is aging and needs to be updated?
- How effective is our material for teaching specific skills?
- Which courses receive the highest ratings from students?
This last question is one of the more simple and helpful ones to answer, so let’s explore it as if we are a new data analyst or developer on the job.
Step 1: Get Raw Data
Data is everywhere, but it isn’t always easy to obtain. This is something to remember if you’re just starting out as a freelancer, entrepreneur, or small business owner. Start collecting data early, and store it in a database. You may need some help architecting your data, but you can’t analyze data and answer questions unless you’re collecting it.
At Treehouse, we need all of this data to make our web app work. We store it in the backend for our web app, but then it’s available to us for reporting purposes via a tool called Mode Analytics. (By the way, if you want some free, public data to explore, check out Five Public Datasets, and Lots of Ideas for Exploring Them.)
In this example we’re specifically interested in a table called “content_feedback_responses”, which holds feedback ratings from students on individual videos, quizzes, or code challenges.
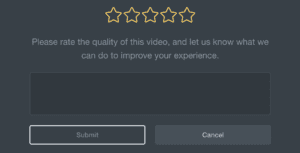
At the end of each step of a course, students can add a rating and provide feedback.
Step 2: Clean and Prepare Your Data
Not only can it be hard to get data, but rarely is it in perfect shape, ready to import and analyze! One of our data scientists, Ilse Ackerman, recently shared this quote from an article: “If Universities truly want to teach Business Analytics instead of ‘Machine Learning on the Cleanest Datasets Ever’ course they need to work with students on real, messy data where nothing is obvious and one deadly trap follows another.”
This work is often tedious and frustrating. Even if your data is organized and collected in an efficient manner, things can go wrong, or you’ll find that you need to tweak things to fit the analysis you’re working on. Be prepared for investigation, trial and error, and lots of adjustments to get things right. We cover “Cleaning Data” in our Data Science Basics course, and will expand on it in the near future.
In this specific case, the data in “content_feedback_responses” is cleaned and standardized thanks to hard work from our developers and data scientists. (Thanks!) By the way, the easiest way to enjoy your work is to work with amazing people. 😉
Step 3: Experiment!
This next step can be daunting. How should we start trying to make sense of this data? If you’re lucky, your data is organized in an intuitive manner, and you may be able to make sense of it on your first pass. In the “content_feedback_responses” table, I don’t need to ask anyone what the numeric “rating” column means, where all the values are 1-5. But I do need to make sense of the other pieces of information that help me connect each rating to a course. In a database like this, that means asking about or investigating foreign key relationships to make sure I’m mapping to the correct related data, like a course title.
In other examples, this may require asking for help from people who understand the data better than you do. Just don’t be afraid to ask. One quick way to invalidate your work is to make assumptions that are incorrect. Analyzing data is an iterative process, full of trial and error, and you’ll need to be very confident in your analysis before sharing or acting on it.
As you explore the data during this phase, you may start to make certain assumptions. Make sure you document these so you can revisit them later. You may need to reflect on how you came to certain conclusions, or share with others who need to understand your work.
In trying to answer the question “Which courses receive the highest ratings from students?”, we want to be able to look at rating averages for each course. I recommend first experimenting with a small data set that you can manually validate. In this case that means we’d like to look at ratings for a few courses that are new and only have a small number of ratings. We can then calculate the average with a calculator and paper, which will show if our automated calculations are correct.
Introducing JavaScript was published recently and has only 78 ratings so far, which means we can go through item by item, if needed:
| TOPIC | TITLE | NUM_RATINGS | AVG_RATING |
| JavaScript | Introducing JavaScript | 78 | 4.63 |
Step 4: Refine and Test
At this point in the process, our work isn’t that different than people who worked with pencils and paper to balance budgets or track inventory before computers were available. We have manually calculated the average rating for a new course. But now we can run the same calculations on a bigger set of data. Instead of one, we can look at many. Instead of a recent event, we can look at an entire history.
This phase of work focuses on iterating and testing. When we run these calculations on all courses at Treehouse, we want to look through the results for any outliers. For example, the ratings we are studying can only go from one to five. If any course has an average below one or above five then we obviously have an error.
Outliers and aberrations may be easy to spot in small data sets or fairly straightforward analysis. As our data or analysis gets more complicated, we’ll need to rely on more advanced statistical and data science techniques to tease out errors and quantify our confidence in our results.
One key thing to remember in this phase is to randomly spot check some of your results. The manual validation from the previous phase was important to prove that our initial calculations were correct. Random spot checks of a few items at this point help validate that those calculations are working correctly across the larger data set.
In this feedback example, let’s take a look at two other courses: one that has been available for years, and another that has been public for a few months. It’ll be a bit of work to validate courses that have more ratings, but we can put the raw data into a spreadsheet and use the AVERAGE function instead of doing it by hand:
| TOPIC | TITLE | PUBLISH_DT | AVG_RATING |
| Development Tools | Console Foundations | 2013-02-04 | 4.37 |
| JavaScript | Node.js Basics | 2017-01-25 | 4.65 |
Step 5: Communicate Results
There are two key pieces of this last phase that could easily be split into individual phases. The next step is often visualizing our results in some way, like a chart, graph, scatter plot, or heat map. This isn’t always necessary, but it’s vitally important for certain types of analysis.
We have one course on data visualization with a Python library called Bokeh, and we’ll add more soon because this is an important aspect of understanding and communicating our results. Proper visualization can effectively summarize complex research at a single glance. This is helpful for us to make sense of our own analysis, but also to share with others who need to make decisions or do things based on our analysis.
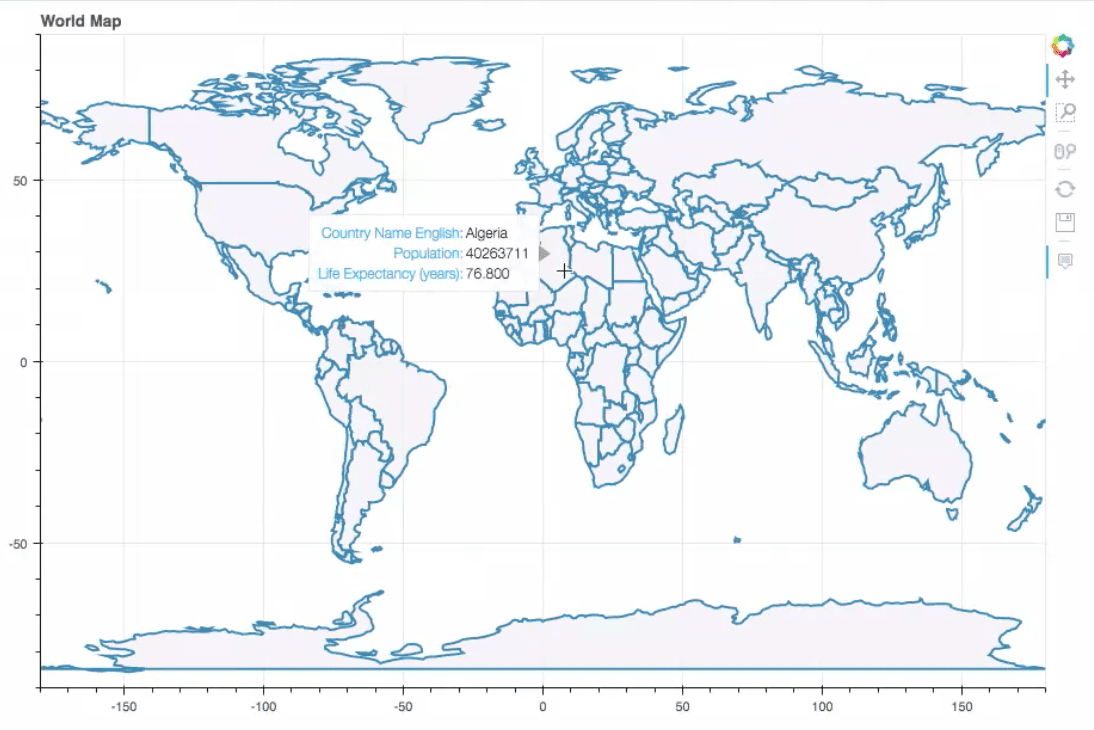
Learn how to create interactive visualizations with Bokeh.
The second key piece of this last phase is communicating with others about our analysis. Rarely will you be the only person making changes based on your analysis. More often, you will need to share your results with a team, or with your manager, and you’ll want to focus on the takeaways that answer their questions and give them what they need to make good choices.
In our example report, let’s simply summarize the key information about our top five courses:
| TOPIC | TITLE | TEACHERS | PUBLISH_DT | AVG_RATING |
| JavaScript | Using Create React App | Guil Hernandez | 2017-07-26 | 5 |
| HTML | HTML Basics | Guil Hernandez | 2017-07-12 | 4.91 |
| WordPress | What Is WordPress? | Zac Gordon | 2017-01-31 | 4.85 |
| JavaScript | Introducing Arrow Function Syntax | Andrew Chalkley | 2016-11-08 | 4.81 |
| CSS | Creating a CSS Marquee | Nick Pettit | 2017-04-25 | 4.59 |
(Nice work, Guil!)
More Questions? That’s Good!
Don’t be frustrated when your analysis invites further questioning. That’s good! Like anything else, we want to hone our approach as new information comes in. In this course example, we may want to follow up on questions like:
- How many students have taken each course?
- Two of the top five are from the past month. Is there a newness bias in our ratings?
Data analysis is important work that anyone can do. While it’s great to lean on experts to provide answers and insights to tough questions for an organization, everyone should be empowered by their own abilities to dig for answers. While I don’t want to minimize the importance of the scientific method needed for certain types of work, I do want to emphasize how these skills seep into so many roles. Or in other words, you’ll need to study hard to become a data scientist, but you can start today taking a deeper look at data currently available to you.
I have nieces and nephews at various stages around the start of their careers, and I recommend to all of them to learn and practice how to make sense of data. Good decisions depend on good data, and good decisions lead to success.
If you have questions about how to start learning data analysis, let us know! We’re here to help and want to enable every individual to understand data and make better decisions.
Thanks to OTA Photos for use of the image of a woman working on a pie chart on a laptop.
Start learning to code today with your free trial on Treehouse.
https://blog.teamtreehouse.com/learn-the-basics-of-spreadsheets-with-treehouse


When someone writes an article he/she maintains the plan of a
user in his/her brain that how a user can understand it.
Thus that’s why this paragraph is great. Thanks!