
The Chrome DevTools is a set of panels built into the Google Chrome browser that help web developers inspect code. You can access the DevTools using shortcut keys (Ctrl+Shift+i on Windows and CMD+Option+i on Mac) or by right clicking anywhere on a webpage and selecting Inspect Element from the context menu. Using these tools, you can debug CSS, profile JavaScript performance, view network activity, and so much more.
I recently released a course on Treehouse called Chrome DevTools Basics which gives a detailed overview if you want to start from the beginning. However, there’s so much functionality packed into the DevTools that it’s hard to know about everything that’s there. Here are five less obvious features of the DevTools that most developers don’t know about!
Contents
1. Force Element State
Let’s start with an easy one that everyone can use. In the Elements panel of the Chrome DevTools, you can right click on any HTML element on the page. This will bring up a context menu with many options, one of which is a submenu labeled Force Element State. Inside of this submenu you’ll see that you can apply several common pseudo classes, including :active, :hover, :focus, and :visited.
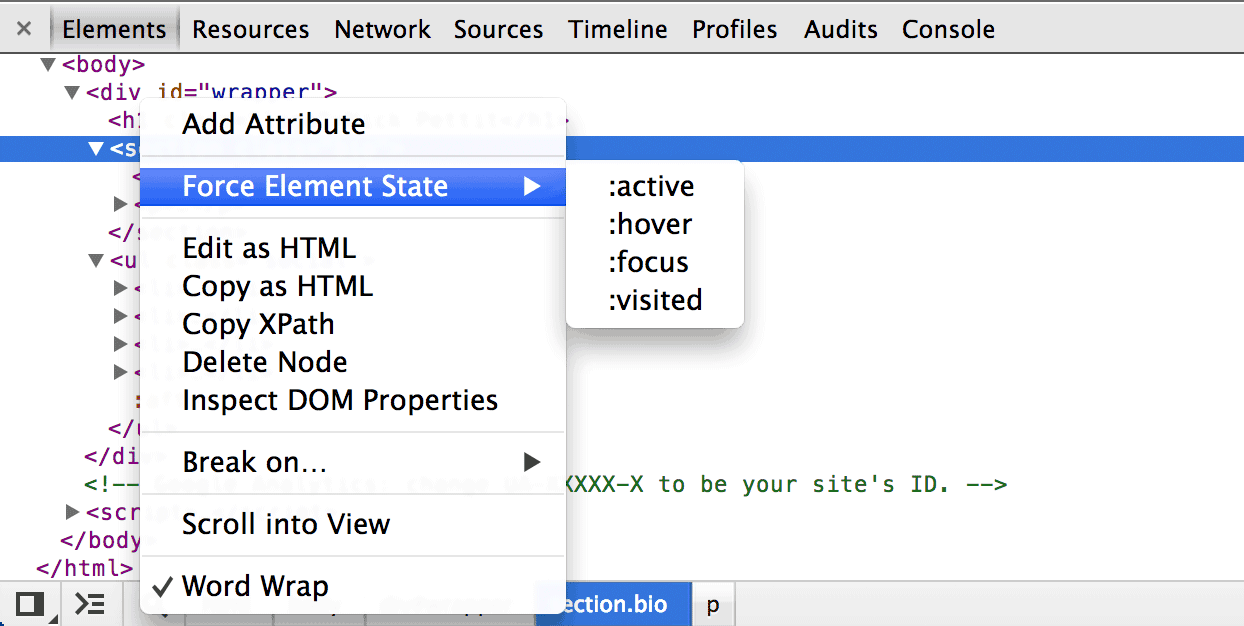
This is incredibly useful if you’re trying to debug CSS or JavaScript that relies on these pseudo classes. In the case of a stylesheet, you might want to experiment with some special :hover styling applied to a button. By forcing the element state, you can simply apply some CSS directly in the Chrome DevTools instead of editing in your text editor, refreshing the browser, hovering over the button, going back to the text editor, and so on.
2. DOM Breakpoints
Many developers are familiar with the breakpoints that can be added to JavaScript in the Sources panel of the Chrome DevTools. Applying breakpoints to specific lines will break (pause) your JavaScript during execution so that you can get a better look into what’s going on. However, many people don’t realize that you can also break any time the HTML is modified.
In the Elements panel context menu is another item labeled Break on… with several submenu items. This submenu includes the items Subtree Modifications, Attributes Modifications, and Node Removal.
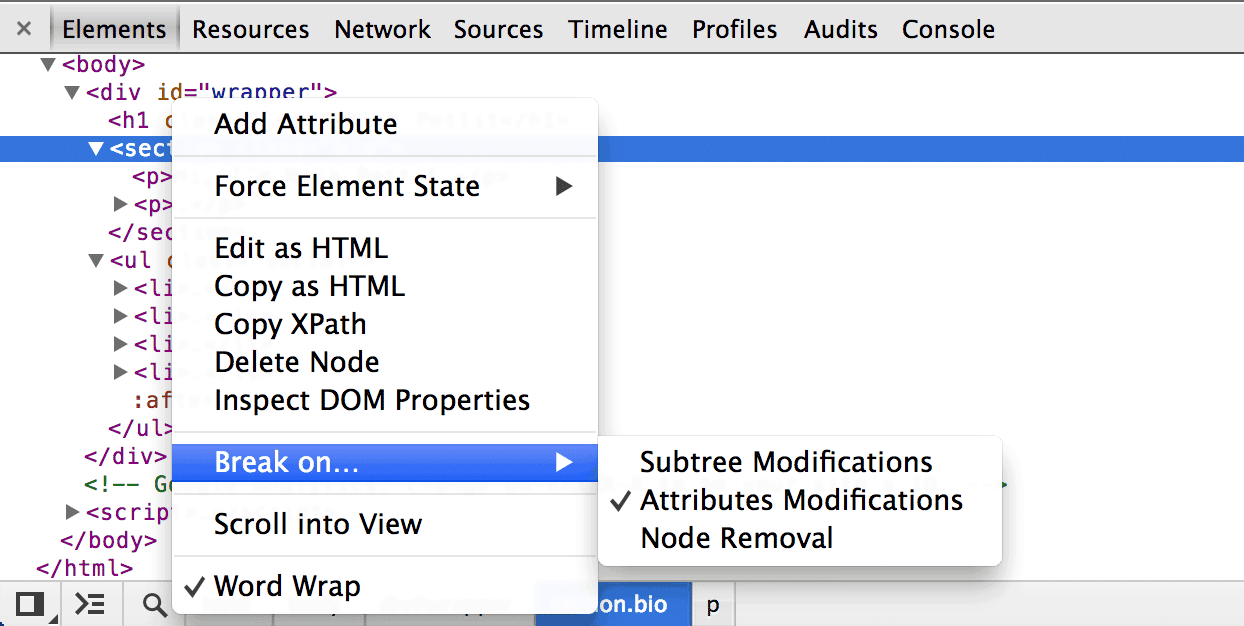
Often JavaScript code will modify the HTML code of a page in some way, but if your page isn’t behaving the way you expect, then you might be able to debug the problem by carefully watching how elements are modified.
- Subtree Modifications item will break if there are any child elements that are added, removed, or modified.
- Attributes Modifications item will break if the element’s attributes change in any way.
- Node Removal will break if the element is deleted entirely.
If you’d like to see this in action, here’s a demo in the Chrome DevTools documentation.
3. The Console API
The Console is a very powerful panel in the DevTools because it allows you to execute arbitrary JavaScript directly on a page as well as view any errors or log messages that the page is outputting. Many developers know they can use the console.log() method to print messages to the console. This is useful for many purposes, such as viewing the values of variables or determining whether or not a specific conditional statement was indeed executed.
However, console.log() is just one method accessible through the Chrome DevTools Console API. Another useful method is console.count() which can be used to count the number of times a block of code has been executed. For example, while debugging JavaScript, you might suspect that a function is being executed more times than it should. Using the console.count() method, you can find out for sure.
There are many other useful methods, so be sure to check out the Console API Reference.
4. The Audits Panel
OK, so this one isn’t exactly hidden. However, developers spend a lot of time in the Elements panel or the Console, so it’s easy to overlook the Audits panel. This powerful tool automatically inspects several aspects of your web page’s performance and identifies areas for improvement. It’s difficult and often impossible to perfectly optimize every web page on every performance factor, but this still provides a good sanity check for areas you might have missed.
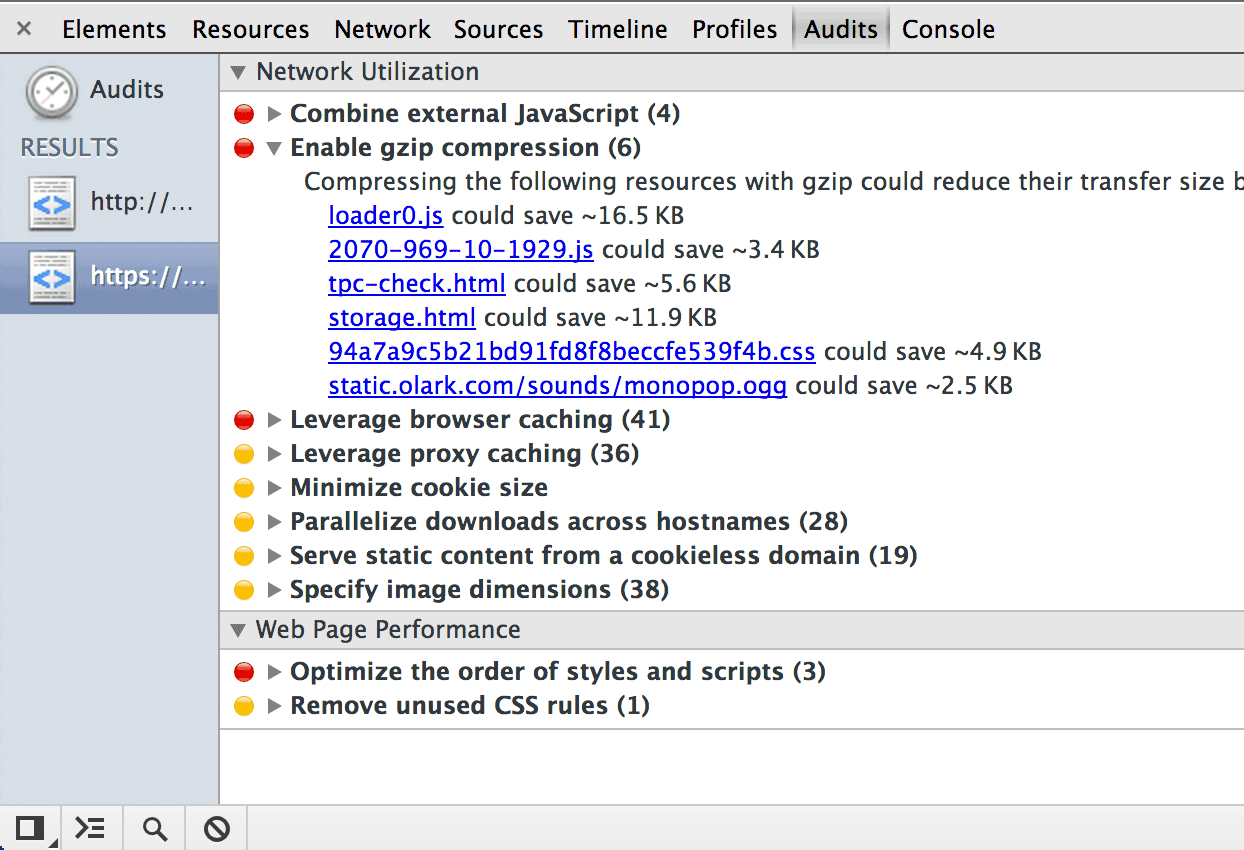
When you bring up the Audits panel, you can select which audits you’d like to run. You can optionally select to reload the page and run the audits at load time. After running an audit, you’ll be provided with a list of several common front-end performance best practices that can be applied to your page. Again, this isn’t a requirements list; they’re just helpful automated suggestions.
5. Additional Network Panel Columns
The Network panel in the Chrome DevTools paints a vivid picture of network activity. You can see which assets were loaded, when they were loaded, in what order they were loaded, and so on. This is represented in a colorful chart with several columns containing additional information about each asset. Some columns are enabled by default, but the majority of the available columns are hidden! You can access these columns by right clicking on any column header and, from the context menu, selecting the column you would like to enable.
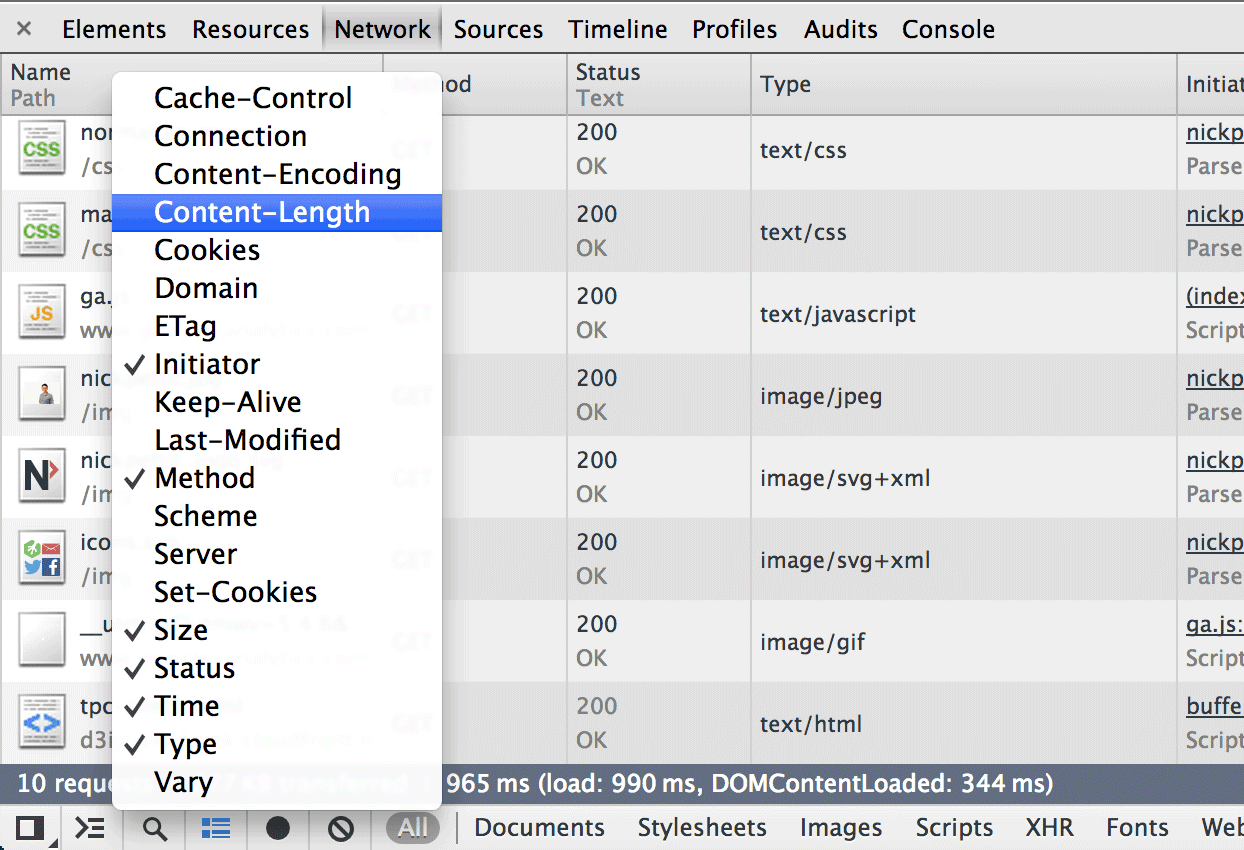
Here’s a full list of the additional columns that are normally hidden:
- Cache-Control
- Connection
- Content-Encoding
- Content-Length
- Cookies
- Domain
- ETag
- Keep-Alive
- Last-Modified
- Scheme
- Server
- Set-Cookies
- Vary
Full disclosure: I don’t quite understand what every one of these does yet (I can’t find any complete documentation for these), but if you do know, feel free to elaborate in the comments. However, many of them are obviously useful right away. For example, by enabling the Content-Encoding menu item, you can see which assets are being served gzipped. This is helpful when you’re trying to minimize asset transfer time.
It’s amazing that the Chrome DevTools manage to stay elegant and simple to use when there are so many powerful features available. If you have any more tips or tricks, please share them in the comments!


Very helpful. Thanks!
#2 got it from here.. thanks..
thanks !
So I was once able to load the devtools without actually being on a page. Problem is I forgot how I did it (hehehe). If anyone knows I’d appreciate it if you shared how you got to it.
Absolutely useful post. I already knew a couple of them, but had completely missed the “Audits” tab. Thanks for the advice!
Does anyone of you know of a screenshot extension to the developper tools. I would like to make screenshots of different mobile resolutions and now it’s kind of tedious.
Any help appreciated 🙂
download ninbus screenshot or awesome screenshot extension / plugin.
Don’t forget SASS source maps
https://developers.google.com/chrome-developer-tools/docs/css-preprocessors
Regarding No. 5, those are HTTP headers. If you’re not familiar with some of those, Google should provide more than enough information about each of them. So pick one of those additional headers that you find interesting, check which values are set for it on a bunch of sites to get a broad picture, and optionally Google search for a definition.
lol at the foot note
Very helpful.
Thanks!
Thanks!